Upload trades in JSON or CSV. Get a forensic breakdown of every edge you have — and every edge you're leaving on the table.
Free forever
Edgeable is free to use, forever — full dashboard analytics, Monte Carlo, and prop presets. No credit card. No trial that expires. Jump in and run your numbers.
A complete quantitative workbench built for serious futures traders. Drop in JSON or CSV and walk out with a full strategic picture.
Equity Curve & Drawdown
Cumulative equity charted against every drawdown from peak. See exactly where your strategy is bleeding — and how quickly it recovers. Daily P&L histograms show the shape of your distribution at a glance.
Monte Carlo Simulation
Up to 25,000 randomised reruns of your trade sequence. Know your real pass probability on a prop challenge, your funded account survival odds, and your equity distribution at 10th, 50th, and 90th percentiles — before you risk a cent.
Position Size Optimisation
Full contract sizing table from 1 contract to your configured max. Net expected value, survival rate, and passing probability at every level — so you pick the size that maximises return without blowing the account.
Prop Firm EV Calculator
Factor in eval costs, reset fees, activation fees, payout caps, and your historical pass rate to compute the true expected value of any prop firm cycle. Know if the game is worth playing before you subscribe.
Session & Instrument Breakdown
P&L, win rate, and trade count sliced by session (London, New York, Asia) and by instrument (NQ, MNQ, GC, MGC). Find where your edge is strongest — and where you should stop trading.
Risk-Adjusted Ratios
Sharpe, Sortino, Calmar, Profit Factor, and more — calculated from your actual trade data. Not modelled. Not estimated. Your real numbers, telling you whether your returns justify the risk you're taking.
Streak & Consistency Analysis
Max win/loss streaks, current streak, and a consistency check against prop firm rules. See if any single day is dominating your P&L — a key requirement for funded account payouts at Apex, Topstep, and MFF.
Kelly Criterion Sizing
Optional Kelly-based position sizing for live account traders. Input your win rate and average R:R and get the mathematically optimal fraction of capital to risk — with a half-Kelly conservative option built in.
Snapshot Export
One-click PNG snapshot of your full analysis report. Share with a trading group, archive for review, or send to a prop firm for performance verification. Everything rendered locally — your data never leaves your device.
How It Works
THREE STEPS. FULL PICTURE.
01
Import Trades (CSV or JSON)
Upload broker or journal exports directly. Edgeable auto-detects common CSV headers (Rithmic, Tradovate, NinjaTrader, TradingView) and supports native JSON exports.
02
Configure Your Account Mode
Choose Prop Firm or Live Account mode. For prop, pick your firm from the preset list (MFF, Apex, Topstep, TPT, Tradeify) or manually enter your own rules. For live, set your risk %, drawdown type, and sizing method.
03
Read Your Full Analysis
The engine runs up to 25,000 Monte Carlo simulations and generates your complete strategic report — KPIs, charts, breakdowns, sizing tables, EV analysis, and a payout requirements checklist — in seconds.
EDGEABLE
PROP FIRM
Net P&L
+$4,820
Win Rate
63.4%
Sharpe
2.14
Max DD
-$820
Cumulative Equity Curve
Trade Statistics
Profit Factor2.31
Avg Win+$148
Avg Loss-$64
Sortino3.07
Monte Carlo — Challenge
Pass Prob.78.4%
Median Days11d
Best Size3 cts
Cycle EV+$3,200
One Ecosystem
TRADE WITH SYNCER. ANALYSE IN EDGEABLE.
Already using Edgeable Syncer? Your trade flow is the advantage: execute and copy in Syncer, then review the same performance in the analyser without manual exports.
Step 01
Trade & Copy
Run your accounts through Syncer and keep your execution workflow in one place.
Step 02
Analyse & Iterate
Open Edgeable and break down win rate, drawdown, EV, and pass probability with the same strategy context.
Every Metric That Matters
30+ STATS. ZERO FLUFF.
Edgeable doesn't just count wins and losses. It runs the full quant stack — the same metrics that professional fund managers use to evaluate strategy viability.
Net P&L
$
Total realised profit in dollars, accounting for your point value per instrument and contract size.
Win Rate
%
Percentage of trades closed in profit. Broken down further by session, instrument, and direction.
Sharpe Ratio
S
Risk-adjusted return relative to volatility. Uses your configured risk-free rate for accuracy.
Max Drawdown
DD
Largest peak-to-trough equity decline in your dataset. Shown in dollars and as a % of peak equity.
Profit Factor
PF
Gross winning P&L divided by gross losing P&L. Above 1.5 is tradeable; above 2 is strong.
Sortino Ratio
Sr
Like Sharpe but only penalises downside volatility — a fairer view of asymmetric strategies.
Calmar Ratio
Cr
Annualised return divided by max drawdown. Measures how much you earn per unit of peak pain.
Expectancy / Trade
E
Average expected dollar return per trade. The most important single number for long-run viability.
Half-Kelly sizing
½K
Recommended fraction of capital to risk per trade from your edge and variance — the pragmatic alternative to full Kelly.
Monte Carlo
MC
Thousands of synthetic paths through your rules to estimate pass probability, time-to-pass, sizing sweet spots, and cycle expected value.
Join the community
Hop into Discord for chat and support, or drop your email for product updates — no need to leave this page.
Whether you're grinding prop evaluations or trading your own capital, Edgeable has a mode calibrated to your exact situation.
Prop Firm Mode
Challenge & Funded
For traders navigating prop firm evaluations. Set your firm, account size, drawdown limits, and consistency rules — or pick from a built-in preset library. The dashboard tracks your challenge progress and tells you if your strategy can pass.
Presets for MFF, Apex, Topstep, TPT, Tradeify, Bulenox
Live Account Mode
Personal Capital
For traders managing their own funds. Set your starting balance, max risk per trade, daily loss limit, and drawdown type. The dashboard projects your equity forward and optimises sizing for long-term growth.
Multi-month equity projection (MC fan chart)
Account health & risk exposure summary
Kelly Criterion sizing recommendation
Fixed, Kelly, or % of equity sizing methods
Static or trailing drawdown calculation
Sharpe, Sortino, Calmar at your actual risk-free rate
No Limits mode for personal journals
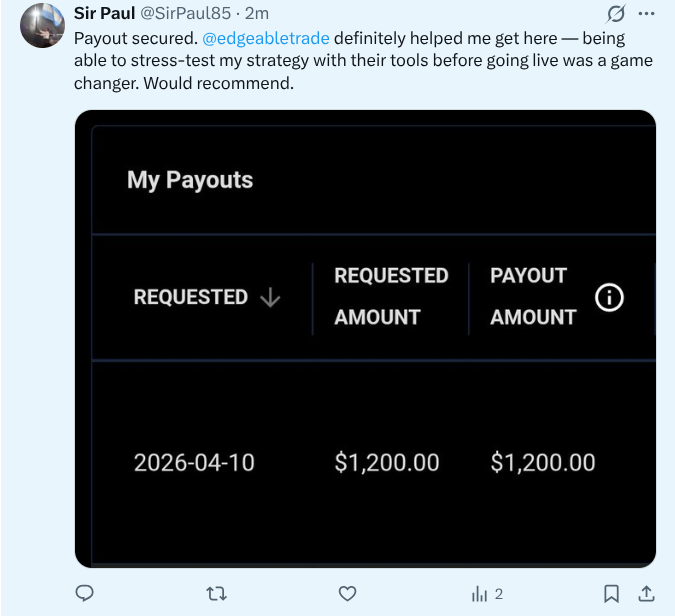
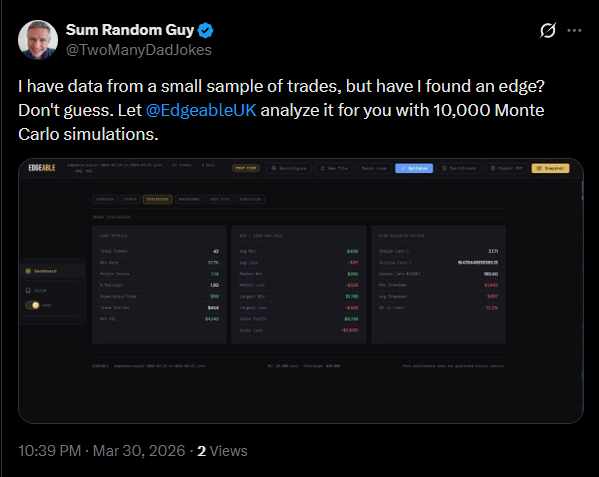
Trader Results
REAL POSTS. REAL OUTCOMES.
Screenshots shared by Edgeable users highlighting challenge passes, payouts, and workflow impact.
Sir Paul · payout secured after stress-testing strategy with Edgeable.
FAQ
QUESTIONS ANSWERED
Free to use, forever — that is the baseline for Edgeable’s core dashboard: upload, analyse, and simulate without a ticking clock or paywall on the essentials. Details below.
Is Edgeable really free forever?
Yes. The core product — metrics, Monte Carlo, prop and live modes, presets — is built to stay free to use without an expiration date. We are not running a “14-day trial then lock you out” model for that layer. Optional accounts (for saves and sync) and any future add-ons do not change that the main analyser stays accessible this way.
Do I need a credit card or paid plan to start?
No. Open the dashboard, load your data, and run analysis in the browser. If we ever introduce optional paid features, they will be clearly separate from the free core — not a surprise gate on what you already use.
Do I need an account?
Not to explore the tool. You can launch the dashboard directly. An account is optional where we offer saved settings or cloud features — see Sign up if you want that. The free tier does not depend on paying.
Where does my trade data go?
The heavy lifting runs in your browser on the main workflow — your files are not uploaded to our servers for that core analysis path. Read more in the guide and the “How it works” section on this page.
Are prop firm pass rates guaranteed?
No. Presets and simulations are models to help you reason about risk and rules — always confirm details with your firm’s official documentation. Edgeable is a research tool, not a promise of evaluation outcomes.
Is there an API?
Partner and API access is documented on the developers page (authentication and limits apply there). The public dashboard remains the free entry point.